
Sensitivity: General
NZUP BROUGHAM STREET IMPROVEMENTS PROJECT
TECHNICAL MEMORANDUM 7: PROJECT IMPACTS ON CLIMATE CHANGE AND AIR
QUALITY
Context
SH76 Brougham Street corridor improvements form part of the Government’s $6.8 bil ion New Zealand Upgrade
Programme that aims to get New Zealand cities moving, save lives and boost productivity. The improvements have
been developed as part of a business case process for the wider Brougham-Moorhouse area developed by Waka
Kotahi and Christchurch City Council.
A multimodal transport plan is recommended for Brougham Street to enhance the operation and performance of the
corridor, making it more efficient, reliable, and safe for all users. This includes a traffic management strategy to make
optimal use of the available road space, together with a range of other interventions to improve safety, enhance
access and prioritise more efficient travel modes and freight.
In the process of seeking endorsements and approvals of the recommended plan, the project team has prepared a
series of briefing notes on specific areas of concern to inform the process and decision makers. They are intended to
complement the Business Case Report and deliverables as well as provide input into communications materials that
Waka Kotahi may develop to inform stakeholders.
Purpose of this briefing note
This briefing note outlines how the proposed NZUP Brougham Street improvements would help reduce greenhouse
gas (GHG) emissions, honouring/ in line with the Government’s commitment to lowering greenhouse gas emissions,
as specified in the Climate Change Response (Zero Carbon) Amendment Act 2019.
It recognises that Climate Change should be addressed in terms of both; mitigation of project impacts on the climate
and adaptation of the transport system to possible climate change impacts.
The primary focus of this note is on Climate Change mitigation measures. The concern of adaptation has been
considered in greater detail in earlier business case work.
Strategic Context
Transport is a leading contributor to GHG emissions as well as one of the fastest growing sources. It accounts for
under the Official Information Act 1982
about 20% of all GHG emissions in New Zealand, with 90% of these from land transport. Most land transport GHG
emissions come from light vehicles in our fastest growing urban areas such as Christchurch.
The Government Policy Statement on Land Transport 2021 (GPS) has climate change as one of four strategic
priorities. The GPS is clear that investment decisions need to:
•
support the rapid transition to a low carbon transport system
•
contribute to a resilient transport sector that reduces harmful emissions
•
give effect to the emissions reduction target the Climate Change Commission recommended to Cabinet
Projects managed or funded by Waka Kotahi must “give effect to” or be “consistent with” the GPS 21.
Released
Toitu Te Taiao - Waka Kotahi’s Sustainability Action Plan sets out Waka Kotahi’s vision for a low carbon, safe and
healthy land transport system. The implementation of this action plan is part of how Waka Kotahi will deliver on the
outcomes of the GPS. Other substantive change is ahead, including the Climate Adaptation Act.
The following figure shows the different sources of emissions from transport projects.

Sensitivity: General
Project Context
Although the NZUP Brougham Street project has not been developed with the primary purpose of reducing GHG
emissions, it is expected to contribute to Climate Change mitigation through measures aimed at:
• using existing infrastructure rather than constructing new infrastructure
• increasing transport choices and encouraging the use of alternative modes including new pedestrian and
cyclist crossing, bus infrastructure improvements, and priority lanes for buses and high occupancy vehicles
• improving traffic management and reducing congestion including bus priority measures, managed lanes,
carpooling, traffic signal optimisation and parking management
• improving freight travel efficiency
• measures to improve the safety for pedestrians, cyclists and other modes.
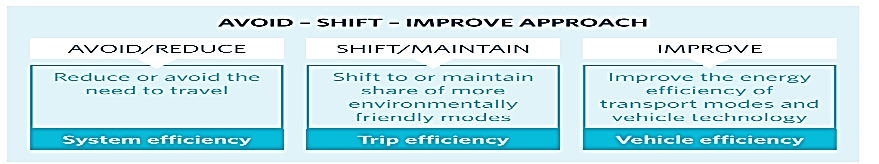
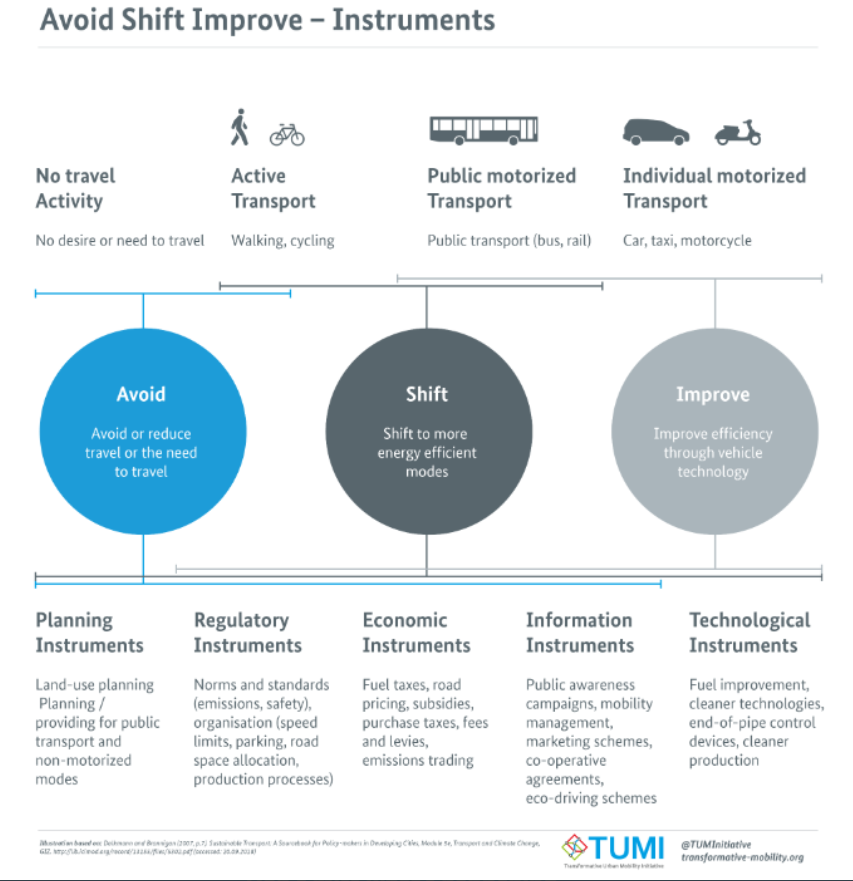
Avoid – Shift – Improve framework
A high-level review of the recommended plan has been undertaken using the internationally recognised Avoid – Shift
– Improve framework1. This is included in Waka Kotahi’s Sustainability Action Plan, Toitū Te Taiao as an approach
for supporting emissions reduction. The review indicates that the plan performs better than other scenarios with no
NZUP investments
.
under the Official Information Act 1982
Released
1 The A-S-I approach was initially developed in the early 1990s in Germany and first officially mentioned 1994 in the
report of the German parliament´s Enquete Commission. The approach serves as a way to structure policy
measures to reduce the environmental impact of transport and thereby improve the quality of life in cities
Sensitivity: General
under the Official Information Act 1982
Avoid measures aim to avoid or reduce the need to travel, or the time or distance travelled by car, The main
interventions in this approach are of a regulatory and planning nature, to integrate land use and transport planning.
Shift measures focus on shifting the mode of travel from the most energy consuming and polluting urban transport
mode (i.e., cars) towards more environmentally friendly modes such as walking and cycling and public transport. A
shift to higher occupancy vehicles (HOV) will also reduce the number of Single Occupant Vehicles (SOVs).
Released
And finally, the
Improve measures which focus on vehicle and fuel efficiency as well as on the optimisation of the
transport system operations.
The A-S-I approach follows a hierarchy where “avoid” measures should be prioritised, followed by “shift” and finally
the “improve” measures.
It is clear that a broad response is necessary both in terms of the type and size of interventions.
The proposal for Brougham Street along with the wider business case is aligned with the ASI framework.
Sensitivity: General
•
A shift to more sustainable modes through the provision of improved infrastructure for walking, cycling, and
priority lanes
•
Improvements to the efficiency of public transport, freight and cars by encouraging higher occupancy vehicles.
Effect of the Project on Enabled Emissions
Traffic modelling
Traffic modelling has been used to predict the effects of this NZUP project on greenhouse gas and other emissions
for the future year of 2028. The citywide CAST model considers how traffic patterns will change with the project, with
a Paramics microsimulation model looking at the detailed operation of Brougham Street. The traffic volumes and trip
patterns used by the Paramics model come directly from the CAST model. This allows for the wider network effects
to be captured by the CAST model whilst the detailed operation of the Brougham Street corridor is covered by the
Paramics model.
The following scenarios were modelled for the 2028 forecast year:
•
Existing Situation – the current layout of Brougham Street, with two general traffic lanes in each direction;
•
Converted Lane – with one managed lane and one general traffic lane in each direction;
•
Added Lane – with one managed lane and two general traffic lanes in each direction
The CAST modelling of the Added Lane scenario considered how the network would operate with the existing split
between SOV and HOV use i.e. operation of the network on opening of the project, as well as a scenario with a shift
from SOV to HOV. This shift would come about as the improvements for HOV’s on Brougham Street will encourage
ridesharing, with a shift from single occupant vehicles. Additional complementary measures to encourage HOV’s and
discourage SOV’s will be required to achieve a significant shift away from SOV’s.
The Added Lane scenario includes a number of safety improvements along the corridor, including right turn arrows,
protected pedestrian movements at intersections, grade separation of the existing Collins/Simeon signalised crossing
(with removal of these signals) and a new signalised pedestrian east of Waltham Road. The provision of right turn
arrows and providing right turn arrows reduce the amount of green time available for through movements on
Brougham Street. However, the extra capacity provided by the added lane means that the green time along
Brougham Street can be reduced without impacting on Brougham Street capacity. As a result, the existing level of
service can be maintained for vehicles in the general traffic lanes whilst improving it for HOVs.
Traffic emissions modelling
Both SATURN (the transportation modelling suite used by CAST) and Paramics have built-in pollution modules, which
calculate emissions. These calculations are relatively sophisticated, taking account of travel speeds, acceleration
and deceleration rates, idling time, primary and secondary stops, vehicle weight, etc. The resulting emissions have
been calibrated against Waka Kotahi’s and Auckland Council’s Vehicle Emissions Prediction Model2 (VEPM) to adjust
them to the New Zealand vehicle fleet composition expected in 2028.
The following polluting emissions are reported from the modelling:
under the Official Information Act 1982
▪
Carbon Dioxide CO2
▪
Carbon Monoxide CO
▪
Oxides of Nitrogen (NOx)
▪
Particulate matter (PM10)
Summary Modelling Outcomes
The CAST model predicted that the Converted Lane scenario would result in faster travel times along Brougham
Released
Street for HOV’s, due to a lessening of congestion in the managed lane. This attracts more HOV’s to the corridor to
benefit from the faster travel times. For vehicles not able to use the managed lane, higher levels of congestion are
expected in the single general traffic lane, resulting in slower travel times. With the reduced capacity and slower
travel times, SOV’s reroute to alternative parallel routes. Overall, there is a decrease in the number of vehicles on
Brougham Street, with the displaced vehicles taking alternative routes.
2 VEPM 6.1
link to page 5 link to page 6
Sensitivity: General
The CAST model predicts that the Added Lane scenario will draw vehicles to the Southern Motorway and Brougham
Street to take advantage of the faster travel times along this corridor. This applies particularly to HOV’s, which are
expected to see time savings on the corridor with the managed lane. Total travel times for all vehicles decrease (i.e.
there is a drop in VHT), though total travel distance increases slightly as some vehicles travel further to access the
improved travel times on the corridor (i.e. VKT goes up). The net result is more vehicles travelling on Brougham
Street with fewer vehicles on the routes parallel to Brougham Street.
With a shift away from SOV’s, there is a general reduction in traffic volumes across the entire Christchurch road
network. The higher speed limit on Brougham Street relative to the surrounding local roads means that there is less
of a reduction on Brougham Street, as vehicles reroute to Brougham Street.
Unlike the CAST model, which has the same total number of vehicles travelling through the network, the number of
vehicles in the Paramics model changes between scenarios as it only includes the Brougham Street corridor (and not
the parallel routes that vehicles can reroute from or to). This means that in the Added Lane scenarios, which see an
increase in the traffic volume along the corridor (as well as entering or leaving the corridor at side roads), the emission
results are for more vehicles than in the Do Nothing and Converted Lane scenarios.
The Converted Lane scenario operates very poorly, with very high levels of congestion and delay on the single general
traffic lane and side roads (with vehicles are blocked by queuing vehicles on Brougham Street).
The Converted Lane scenarios both see reductions in congestion. Retaining the existing 60 kph speed limit does
produce faster travel times, but this is at the expense of safety for all road users and poor co-ordination of the traffic
signals (resulting in an inefficient “green wave” progression along Brougham Street).
Reducing the speed limit to 50 kph loses some of the travel time savings, but it does allow for better co-ordination of
the traffic signals and improved safety for all road users (especially for vulnerable uses walking or cycling along/across
the corridor).
Emissions Modelling Results
Carbon Dioxide (CO2)
The predicted CO2 emissions across the Greater Christchurch area calculated by the CAST model are reported in
Table 1, whilst those generated along the Brougham Street corridor from the Paramics model are i
n Table 2. Both of
these tables report the hourly emissions during each modelled period, which have also been combined to generate
daily emissions.
Table 1: Hourly and daily CO2 emissions in tonnes across Greater Christchurch (CAST model 2028)
Daily
Scenario
AM
IP
PM
Daily
Change
Do Nothing
236.6
186.9
278.7
2,879.1
Converted Lane
237.2
186.9
279.6
2,882.2
+0.1%
under the Official Information Act 1982
Added Lane – No Shift from SOV
236.9
187.1
279.6
2,883.3
+0.1%
Added Lane – Shift from SOV
205.8
164.9
240.0
2,517.8
-12.5%
The Converted Lane scenario shows a slight increase in CO2 emissions in both peak periods compared to the existing
situation due to increased congestion in the general traffic lane on Brougham Street and drivers travelling further to
avoid that congestion. There is no difference in the IP period, when the reduction to a single general traffic lane has
less effect due to lower traffic volumes. On a daily basis, there is a 0.1% increase in CO2 emissions for the Converted
Lane scenario.
Released
For the Added Lane scenario, without any shift from SOV to HOV there is a slight increase in CO2 emissions in each
of the modelled time periods as drivers travel further to take advantage of the faster travel times and lower congestion
on Brougham Street. This results in 0.1% more CO2 emissions across the Greater Christchurch area.
Given the small extent of the project relative to the entire road network in Greater Christchurch, it is not surprising
that the difference in CO2 emissions is very small without a wider programme of measures to encourage people out
of SOV’s (and private vehicles).
link to page 6 link to page 6 link to page 6
Sensitivity: General
With an increase in HOV use across Christchurch, CO2 emissions are predicted to decrease, generally in line with
the decrease in the number of private vehicles travelling on the network. The decrease in CO2 will be slightly less
than the decrease in private vehicles, as the remaining vehicles (including trucks) will reroute to faster routes with the
general lowering in congestion across the network.
Table 2: Hourly and daily CO2 emissions in tonnes along Brougham Street corridor (Paramics model 2028)
Scenario
AM
IP
PM
Do Nothing
6.2
5.2
6.7
Converted Lane
7.6
5.1
8.2
Added Lane – 60 kph
5.0
4.9
7.4
Added Lane – 50 kph
6.2
6.1
6.7
The Paramics modelling of the Converted Lane scenario shows an increase in CO2 emissions in both peak periods,
due to the increased congestion in the single general traffic lane. In the IP period, these emissions are slightly less
than for the existing situation, although across the day there is a 9% increase in CO2 emissions.
Modelling of the Added Lane (60 kph) scenario shows significant reductions in CO2 emissions in the AM period, a
smaller reduction in the IP period and a small increase in the PM period. On a daily basis, the Added Lane (60 kph)
scenario shows a 4% reduction in CO2 emissions along the corridor.
Despite the slower speeds in the Added Lane (50 kph) scenario, peak period (AM and PM periods) CO2 emissions
are practically identical to those for the existing situation (Do Nothing scenario). CO2 emissions increase in the IP
period, resulting in a 10% daily increase.
Note that both of the Added Lane Scenarios have many more vehicles travelling along or across the corridor (a 20%
increase on the Do Nothing and Converted Lane scenarios). So although total CO2 emissions increase in the 50 kph
scenario, the emissions per vehicle decrease compared to the existing situation.
Other Harmful Emissions
Daily emission totals for the other reported pollutants are summarised i
n Table 3 for the wider Christchurch area and
Table 4 along the Brougham Street corridor.
Table 3: Daily CO, NOx and PM10 emissions in kg across Greater Christchurch (CAST model 2028)
Scenario
CO
NOx
PM10
Do Nothing
10,281
5,983
323
Converted Lane
10,322
5,999
324
Added Lane – No Shift from SOV
10,299
5,990
324
under the Official Information Act 1982
Added Lane – Shift from SOV
8,803
5,211
279
Similarly to the outcomes reported for the CO2 emissions
, Table 3 shows that without a shift away from SOV’s, there
will be a very small increase CO, NOx and PM10 emissions across Christchurch as a result of the slight increase in
VKT under the Added Lane scenario. Reducing the number of SOV’s will have the effect of proportionally reducing
CO, NOx and PM10 emissions.
Table 4: Daily CO, NOx and PM10 emissions in kg along Brougham Street corridor (Paramics model 2028)
Released
Scenario
CO
NOx
PM10
Do Nothing
155
91
5.0
Converted Lane
149
88
4.5
Added Lane – 60 kph
149
85
4.0
Added Lane – 50 kph
161
98
4.9

Sensitivity: General
The Paramics model predicts a similar pattern of outcomes for the Added Lane (60 kph) scenario, with decreases in
all harmful pollutants. With the lower speed limit, emissions of CO and NOx are predicted to be higher than in the
existing situation, but the better co-ordination of the traffic signals at 50 kph results in less stop/start activity, producing
a reduction in PM10 emissions with the reduced braking requirements.
Effect of the Project on Construction Emissions
The project mostly involves use of/re-purposing of existing infrastructure, rather than constructing new infrastructure.
Therefore, construction emissions are not a significant component of the project, with the exception of the grade
separated pedestrian/cycle crossing at Collin St Simeon St. A GHG emissions estimate carried out for the NZUP
programme assessed the construction emissions of a proposed grade separated pedestrian cyclist overpass crossing
at Collins/Simeon. The assessment estimated embodied emissions associated with the consumption of materials in
the construction, such as steel and cement.
The result of the CIPA assessment for embodied emissions is summarised in table below
under the Official Information Act 1982
Conclusions
The primary focus of this note is on assessing how the NZUP Brougham Street proposed improvements are likely to
Released
impact on greenhouse gas (GHG) emissions and local air quality.
The recommended option (with Added Lane scenario - with one HOV Lane and two General Traffic Lanes with 50
km/h speed limit) shows the effectiveness of the managed lane in achieving less traffic congestion, carbon
reduction and other related benefits, such as reduced travel delay, greater use of carpool, buses and alternative
modes, improved safety, and enhanced economic activity.
Sensitivity: General
For the recommended option, there are reduced adverse environmental effects across the peak periods due to more
HOVs using Brougham Street and the more efficient operation of the corridor. This will assist in meeting carbon
emissions reduction targets and aid climate change mitigation efforts.
This is because of the reduced number of vehicles and passengers in the general traffic lanes and because the
proportion of passengers using the HOV modes (which are both better environmentally and travel faster than the
SOVs) is greater.
If the improvements for higher occupancy vehicles, buses and active modes on Brougham Street are supported by
complementary measures from regional and local partners, much greater reductions in CO2 emissions are possible
than could be achieved by this project in isolation, furthering local, regional and national climate change goals.
under the Official Information Act 1982
Released